2020 vision: how data can paint a picture of the pandemic

Around the world, governments are struggling to respond to this novel, fast-moving and catastrophic pandemic. At a recent GGF webinar, an international panel explored how data can reveal COVID’s behaviour and its impact on societies and economies – enabling public servants to combat the disease and protect their citizens. Natalie Leal reports
Until we develop a cure or vaccine for COVID-19, the most powerful tool at governments’ disposal is social distancing. At the national level, it’s clear that imposing movement restrictions drastically slows the disease’s spread. But to use these blunt instruments intelligently, governments need data on compliance: monitoring changes in public interactions at the local level, they can link this information to data on local infection rates – providing a detailed picture of the relationship between the two – and raise the alert when rises in local mobility risk a new outbreak.
During the last pandemic of this scale, a century ago, public servants had no way of effectively gathering such information. But in today’s data-rich world, governments can gain access to accurate, real-time datasets via a huge range of sources – from satellites to retail sales; benefits claims to social media. At a two-part Global Government Forum webinar held in late July, data experts from national governments, the UN and knowledge partner Mastercard considered how civil servants can use data to slow the spread, reduce the impact, and heal the damage of COVID-19.

In the case of monitoring public mobility, for example, anonymised data from mobile phone companies is enormously helpful, said Ronald Jansen, Chief of the Data Innovation and Capacity Branch in the United Nations’ Statistics Division. “A lot of the work on big data and [the] COVID-19 response concerns the use of mobile phone data, given that human mobility is one of the major factors in the spread of the disease,” he explained, noting that aggregating data on the movements of mobile phone users enables officials to “review and evaluate” the effects of movement controls.
“Statistical agencies have started to use more of this, because they see that with this timely data, government policies can be informed immediately and they can adjust policies in a very timely manner,” Jansen added, citing Haiti and Estonia among the countries the UN has helped to access mobility data. “These are indicators which can show the effectiveness of people restricting their mobility” in slowing infection rates, he said – providing invaluable evidence of policies’ efficacy.
Live travel updates
In some cases, tech firms can help governments to assemble and analyse data: Mark Palmer, head of public sector for Google Cloud’s Europe, Middle East and Asia operation, explained that his firm has been using “aggregated and anonymised data to chart movement trends in towns all around the world,” generating local mobility reports. This data “pinpoints movement trends and busyness in specific locations like transport hubs, retail, recreation and so on, so governments and researchers can see how people are moving and how busy people are in a certain very defined region,” he said.

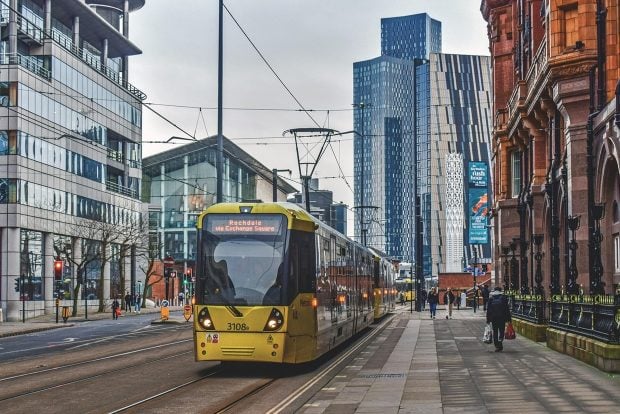
Such data can also help public sector managers to maximise capacity in public transport, he added. While social distancing rules create a “fundamental capacity problem” which can only be tackled by policy, Palmer explained that by tapping into multiple sources of data, governments can build a detailed, real-time picture of public movements and transport use. “This is really bringing Internet of Things [IOT] into action by collecting data from things like beacons, counters, cameras, ticketing machines and so on, to give a precise picture of busyness,” he said.
Unsurprisingly, Singapore has used many types of data to track mobility and “busyness” – introducing a raft of digital tools, and “rolling out measures on all different fronts,” explained Ms Quek Su Lynn, director at Singapore’s Smart Nation and Digital Government Office. The government’s “response to how we manage COVID-19 has been quite multifaceted,” she said, with data used “extensively” to curb transmission.
Contact tracing
One key element has been the city-state’s contact tracing system. The TraceTogether app identifies people who have come into close contact with other app-users who have tested positive for COVID-19, including strangers such as fellow passengers on a bus. Data from the app is then used to contact people quickly and quarantine them, slowing the spread of the virus. It’s not been perfect. Low take-up rates of the app have hampered its effectiveness; a Bluetooth-enabled wearable tracking device was introduced for people without smartphones at the end of June. But overall, Singapore’s “multifaceted” approach seems to have successfully contained the virus, getting on top of a spike in infections in April.

Another scheme to complement the TraceTogether app is SafeEntry: a national digital check-in system collecting people’s contact details in crowded areas such as supermarkets, offices – anywhere “people tend to gather for a prolonged period of time,” explained Quek. SafeEntry “essentially acts as a memory aid to enhance activity mapping by the contact tracers.”
Activity maps using anonymised data can provide “a visual understanding of how the disease has been moving, the patterns of the transmission,” she said, providing information on whether there are “certain high-risk settings we have to pay more attention to.”
“Busyness” data is useful for citizens too, and can support helpful behaviour change among citizens. For this reason Singapore launched SpaceOut, which publishes real-time data on a dashboard showing crowd levels in public places such as shopping malls and stadiums. Singaporeans can then “decide whether or not they want to visit that place knowing that there are a lot of people there – or they could visit it at a time that is less busy,” Quek said.
‘Now-casting’
The Australian government has also been making use of real-time indicators during the pandemic. COVID-19 hit Australia just as it was reeling from the 2019 bushfire crisis, explained Alistair Campbell, assistant secretary for COVID-19 data in the Department of the Prime Minister and Cabinet. Quite early on, “we found that forecasting became a bit of a mug’s game” explained Campbell; the situation was fast-changing and extremely uncertain, and “we weren’t using up-to-date data to write those forecasts.” Instead, his team set about finding real-time data sources that would enable them to provide a current picture of the virus’s spread and behaviour, then began a programme of “now-casting” – providing the prime minister with “as up-to-the-minute picture about what the data tells us as possible.”

This has involved drawing on information “wherever we can get it,” he explained – including cold-calling organisations with large datasets that could be useful. For example, if a fast-food chain has data that could help determine how many cars are passing though a certain location, “we literally just call them up and ask. We find that companies are actually kind of often amazed to be approached by government in that kind of proactive manner.”
But while data is available to governments from multiple sources and in various forms, many countries have hit obstacles when attempting to use it. One problem is agencies working in outdated silos, said Francisco Rodriguez, head of Chile’s central digital team: the Digital Government Division in the Ministry of the Presidency. Integrating systems to allow the government to tap into the power of big data, he said, involves both changes to technology networks and “the mindset of public servants”. Many public servants think in terms of departmental silos, he said, and this is “a huge issue of culture that we are just addressing.”
Share and share alike
This has been a challenge in Singapore too, commented Quek – though the country’s Public Sector Governance Act, enacted prior to COVID in 2018, has proved really helpful during the crisis. “In Singapore we’ve had this concerted effort to start using data much more widely,” she said. “What we really wanted to overcome initially was the mindset that data belonged to a specific organisation and the conservative attitude with regards to allowing other agencies to be able to use it.”
Cross-agency data-sharing has improved, she added, but “we still have some way to go in trying to instil this culture within the government. That [data] is not just the asset of one organisation, but can be used as a common resource for the government to serve the citizens better. But we have to do it in a very secure way, and in a very responsible way.”

All panelists agreed there is still plenty of untapped potential as the world moves away from the initial emergency response and towards addressing the economic and social impacts to come. There is more mileage, for instance, in using big data to help reconstruct the economy. Jobs are not going to be the same following the pandemic, commented Rodriguez: there are “many skills and competencies that are out there” which “are not mapped and that, I would say, are crucial to start to answer the question of a new market fit in terms of what organisations need and what people can offer.”
Overlapping mapping
In part, governments will start to realise this potential when they cross-reference datasets from different sources – providing a much fuller picture. “I think there is still a lot of potential there which we haven’t used,” said Jansen. “There are a lot of different datasets out there but the way we use them, we use them one by one and fill in parts of the picture.”
But perhaps the biggest challenge is to condense the complexities of big data into simple, presentable facts. “As a data community, we often get attracted to the cool new things,” said Campbell, creating the risk that professionals “overcomplicate” issues. “What decision-makers have found most useful in the COVID environment”, he added, are more simple measures.
For every dataset and piece of analysis, “we need to work out how we can present really complex things really simply,” he concluded. “The world map is incredibly complex, but it’s on one page.”
This report covers the second session of GGF’s two-part, 22 July webinar ‘Know your enemy: using data to tackle COVID-19’. You can watch the whole session below and download the slides here. Our report on the first session, along with the full video recording, is also available on our website.


